O que há de Novo?
Fórum Outer Space - O maior fórum de games do Brasil

Registre uma conta gratuita hoje para se tornar um membro! Uma vez conectado, você poderá participar neste site adicionando seus próprios tópicos e postagens, além de se conectar com outros membros por meio de sua própria caixa de entrada privada!

  • Anunciando os planos GOLD no Fórum Outer Space
    Visitante, agora você pode ajudar o Fórum Outer Space e receber alguns recursos exclusivos, incluindo navegação sem anúncios e dois temas exclusivos. Veja os detalhes aqui.


Tópico oficial AstrônomOS / FisicuzinhOS | 1a foto de um buraco negro p.35 | Mãe, no céu tem VY Canis Majoris? E morreu p.62 | Fotos TESUDAS James Webb p.63, 64...

Qual o teu nível de conhecimento sobre astronomia?


  • Total voters
    332

Krion

Ei mãe, 500 pontos!
Mensagens
16.342
Reações
63.429
Pontos
903
Eu meio que não entendi :kawaii

É uma descoberta interessante, do site da NASA com mais detalhes:

Hubble Sees Cosmic Flapping ‘Bat Shadow’

Sometimes nicknames turn out to be closer to reality than you might imagine.
NASA’s Hubble Space Telescope captured a striking image of a fledgling star’s unseen, planet-forming disk casting a huge shadow across a more distant cloud in a star-forming region – like a fly wandering into the beam of a flashlight shining on a wall.
The young star is called HBC 672, and the shadow feature was nicknamed the “Bat Shadow” because it resembles a pair of wings. The nickname turned out to be surprisingly appropriate: Now, the team reports that they see the Bat Shadow flapping!


“The shadow moves. It’s flapping like the wings of a bird!” described lead author Klaus Pontoppidan, an astronomer at the Space Telescope Science Institute (STScI) in Baltimore. The phenomenon may be caused by a planet pulling on the disk and warping it. The team witnessed the flapping over 404 days.

But what created the Bat Shadow in the first place?

shadowy form nicknamed the Bat Shadow
Astronomers using Hubble previously captured a remarkable image of a young star's unseen, planet-forming disk casting a huge shadow across a more distant cloud in a star-forming region. The star is called HBC 672, and the shadow feature was nicknamed the "Bat Shadow" because it resembles a pair of wings. The nickname turned out to be unexpectedly appropriate, because now those "wings" appear to be flapping!
Credits: NASA, ESA, and STScI
grayscale schematic showing how the Bat Shadow "flaps"
This illustration shows a fledgling star surrounded by a warped, saddle-shaped disk with two peaks and two dips. A planet embedded in the disk, inclined to the disk's plane, may be causing the warping. As the disk rotates around the young star, it is thought to block the light from that star and cast a varying, flapping shadow on a distant cloud.
Credits: NASA, ESA, and A. James and G. Bacon (STScI)

“You have a star that is surrounded by a disk, and the disk is not like Saturn’s rings – it’s not flat. It’s puffed up. And so that means that if the light from the star goes straight up, it can continue straight up – it’s not blocked by anything. But if it tries to go along the plane of the disk, it doesn’t get out, and it casts a shadow,” explained Pontoppidan.

He suggests imagining a lamp with a shade that casts a shadow on the wall. In this case, the lightbulb is the star, the lampshade is the disk, and the cloud is the wall. Based on the shadow’s shape, the disk must be flared, with an angle that increases with distance – like bell-bottom pants, or a trumpet.

The disk – a circling structure of gas, dust, and rock – might be roughly saddle-shaped, with two peaks and two dips, which would explain the “flapping” of the shadow. The team speculates that a planet is embedded in the disk, with an orbit inclined to the disk’s plane. This planet would be the cause of the doubly warped shape of the orbiting disk and the resulting movement in its shadow.

“If there were just a simple bump in the disk, we'd expect both sides of the shadow to tilt in opposite directions, like airplane wings during a turn,” said team member Colette Salyk of Vassar College in Poughkeepsie, New York.

The shadow, extending from the star across the surrounding cloud, is so large – about 200 times the length of our solar system – that light doesn’t travel instantaneously across it. In fact, the time it takes for the light to travel from the star out to the perceivable edge of the shadow is about 40 to 45 days. Pontoppidan and his team calculate a planet warping the disk would orbit its star in no fewer than 180 days. They estimate that this planet would be about the same distance from its star as Earth is from the Sun.

If not a planet, an alternative explanation for the shadow motion is a lower-mass stellar companion orbiting HBC 672 outside the plane of the disk, causing HBC 672 to “wobble” relative to its shadowing disk. But Pontoppidan and his team doubt this is the case, based on the thickness of the disk. There is also no current evidence for a binary companion.

The disk is too small and too distant to be seen, even by Hubble. The star HBC 672 resides in a stellar nursery called the Serpens Nebula, about 1,400 light-years away. It is only one or two million years old, which is young in cosmic terms.

This finding was serendipitous. The first image of the Bat Shadow was taken by another team. Later, the image was slated for use in NASA’s Universe of Learning, a program that creates materials and experiences to enable learners to explore the universe for themselves. The goal was to illustrate how shadows can convey information about phenomena invisible to us. However, the original team only observed the Bat Shadow in one light filter, which did not provide enough data for the color image desired by NASA’s Universe of Learning.

To get the color image, Pontoppidan and his team had to observe the shadow in additional filters. When they combined the old and new images, the shadow appeared to have moved. At first, they thought the problem was in the image processing, but they quickly realized the images were properly aligned and the phenomenon was real.

The team’s paper will appear in an upcoming edition of the Astrophysical Journal.

NASA’s Universe of Learning materials are based upon work supported by NASA under award number NNX16AC65A. For more information about NASA’s Universe of Learning, see: https://www.universe-of-learning.org/

The Hubble Space Telescope is a project of international cooperation between NASA and ESA (European Space Agency). NASA’s Goddard Space Flight Center in Greenbelt, Maryland, manages the telescope. The Space Telescope Science Institute (STScI) in Baltimore conducts Hubble science operations. STScI is operated for NASA by the Association of Universities for Research in Astronomy, in Washington, D.C.

For images, video, and more information about this study and Hubble, visit:
https://hubblesite.org/contents/news-releases/2020/news-2020-22
https://www.nasa.gov/hubble

https://www.nasa.gov/feature/goddard/2020/hubble-sees-cosmic-flapping-bat-shadow/
 

Krion

Ei mãe, 500 pontos!
Mensagens
16.342
Reações
63.429
Pontos
903
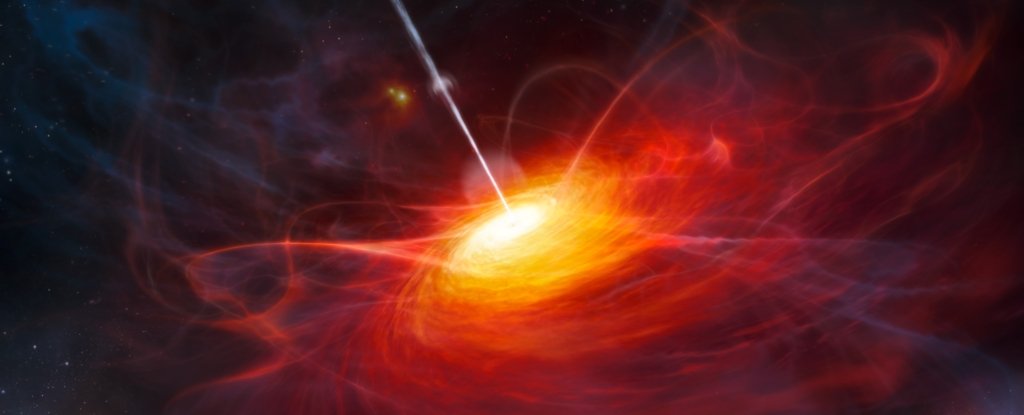
quasar_1024.jpg


This Absolute Monster of a Black Hole Eats The Equivalent of a Sun a Day

One of the largest known black holes in the Universe has turned out to have an appetite to match its prodigious size. New measurements reveal that it's an absolute chonk, clocking in at around 34 billion times the mass of the Sun - and it devours almost one Sun's worth of mass every day.

This makes it the fastest-growing black hole we know of in the entire Universe; its enormity tips it into the category of ultramassive black holes.
"The black hole's mass is also about 8,000 times bigger than the black hole in the centre of the Milky Way," said astronomer Christopher Onken of Australian National University in Australia.
"If the Milky Way's black hole wanted to grow that fat, it would have to swallow two thirds of all the stars in our galaxy."
The discovery of the behemoth in question was first announced in 2018; it powers a blazing quasar in the centre of a galaxy called SMSS J215728.21-360215.1 (J2157 for short) in the early Universe, billions of light-years away.
At time of discovery, astronomers estimated the black hole's mass at around 20 billion solar masses, putting it in the category of ultramassive (over 10 billion solar masses), and its accretion rate - how much material it devours - at half a solar mass a day.
Since then, astronomers have taken new measurements to revise these numbers. And they're mind blowing. At its newly derived mass, the J2157 black hole (J2157*) would have a Schwarzschild radius - the radius of its event horizon - of around 670 astronomical units (AU).

For context, Pluto is, on average, 39.5 astronomical units from the Sun. The heliopause - where the solar wind is no longer strong enough to push against interstellar space - is thought to be over 100 AU from the Sun. Therefore, J2157*'s event horizon is over five times the size of the Solar System.
Those new measurements have revised not just the size and accretion rate of the black hole, but the distance. The adjustment is minuscule given its overall distance from us - just a few tens of millions of light-years. But even such relatively small details matter when it comes to understanding what our Universe was up to when it was barely 1 billion years old.
J2157* is not the heftiest black hole ever discovered. An ultramassive black hole clocking in at around 40 billion solar masses is at the heart of the galaxy Holm 15A, around 700 million light-years away. And then there's the ultramassive black hole powering the quasar TON 618 - an absolute beast at 66 billion solar masses. It's 10.4 billion light-years away.
The black holes of Holm 15A and TON 618 are pretty difficult to understand. We don't know how supermassive or ultramassive black holes form and grow.

But J2157*, hanging around when the Universe was less than 10 percent of its current age, is in a class of its own. Not only do we not know how it formed and grew, we don't know how black holes can grow that massive so soon after the Big Bang.
"It's the biggest black hole that's been weighed in this early period of the Universe," Onken said.
Recent studies, however, have revealed that quasars hosting supermassive black holes didn't just exist in the early Universe - they seem to have been quite common.
This discovery is a huge challenge to our cosmological models, because we know that the formation of such an object should at least take a lot of time, and a lot of matter. So, an ultramassive monster lurking in the early Universe could be another piece of the puzzle.
"With such an enormous black hole, we're also excited to see what we can learn about the galaxy in which it's growing," Onken said.
"Is this galaxy one of the behemoths of the early Universe, or did the black hole just swallow up an extraordinary amount of its surroundings? We'll have to keep digging to figure that out."

--------------------------------

Quem interessar em maiores detalhes técnicos pode consultar o paper original da pesquisa abaixo

A thirty-four billion solar mass black hole in SMSS J2157–3602, the most luminous known quasar


Sgt. Kowalski

Lenda da internet
Mensagens
56.778
Reações
134.090
Pontos
2.139
Nasa adia lançamento de novo jipe e periga perder a janela para Marte


A Nasa teve de mais uma vez adiar o lançamento do seu próximo jipe robótico marciano, o Perseverance. Originalmente planejado para voar em 17 de julho, ele primeiro foi empurrado para o dia 20, depois para o dia 22, e agora não deve partir antes do dia 30 de julho.
O adiamento veio na esteira de um ensaio para o lançamento, que envolveu o abastecimento do foguete Atlas V. Um sensor de uma das linhas de combustível do estágio superior apresentou um sinal anômalo, o que exige uma investigação mais cuidadosa do veículo. Daí a necessidade de adiar.
O drama é que não dá para esperar muito mais. Se o jipe não partir até meados de agosto, perderá a janela de oportunidade que existe para lançamento a Marte. E aí a próxima só vem em 2022.
Se o lançamento prosseguir ainda neste ano, espera-se que o Perseverance chegue ao planeta vermelho no começo de 2021. Além dele, também faz parte da missão um mini-helicóptero experimental, o Ingenuity. O principal objetivo da missão, que custou US$ 2,1 bilhões, é buscar sinais de vida microbiana no passado de Marte.
 

Krion

Ei mãe, 500 pontos!
Mensagens
16.342
Reações
63.429
Pontos
903
All come from dust: Study shows that when dying, stars fertilize the universe with their ashes
7 Jul, 2020 13:36

All come from dust: Study shows that when dying, stars fertilize the universe with their ashes

FILE PHOTO NASA handout photo of a white dwarf star that may have ripped apart a planet © REUTERS/NASA

New findings show that when stars die they gently sprinkle chemical-rich ashes throughout the cosmos. The revelation helps to explain how the element carbon arrived in the Milky Way.

The study, published in Nature Astronomy on Monday, revealed that the final breaths of white dwarfs pollinate space with their element-rich-ashes via stellar winds, spreading chemical elements such as carbon across outer space.

White dwarfs are understood to be the final evolutionary state of stars whose mass has not become high enough to reach that of a neutron star.
“The findings pose new, stringent constraints on how and when carbon was produced by stars of our galaxy,” says Jeffrey Cummings, an Associate Research Scientist in the Johns Hopkins University's Department of Physics & Astronomy and an author of the paper.

ALSO ON RT.COMBreakthrough in dark matter mystery as neutral hydrogen from other galaxies detected for first time
This helps explain how and why the universe ended up littered with the raw material necessary to form our own planetary system.
Carbon, the main element in organic compounds, was essential to the emergence of life on Earth. Although fundamental, its origins are still misunderstood and debated in the astrophysics community.

Some believe it to be sourced via white dwarfs and solar winds, others think that it was blown across infinity from an exploded supernova.
The study involved researchers analysing white dwarfs in the Milky Way’s open star clusters: groups of thousands of stars held together by mutual gravitational attraction.

After measuring the white stars masses, they then retroactively worked out their original masses at birth via stellar evolution theory.
The analysis revealed that, contrary to previous estimates, these white dwarfs had larger masses than believed, producing larger remnants at the end of their lives.

The researchers believe that this hints to how carbon made its way into the Milky Way, in that as they died, these stars produced new carbon atoms in their hot interiors and pushed them out into their interstellar environment.

The study’s model suggests that by reducing the carbon-rich outer mantle of the star, it allowed the central core of the star — which in turn transformed to white dwarfs — to grow considerably in mass.

The carbon carried upon these interstellar winds is also now understood as part of the contributing factor to light pollution from distant galaxies. This study then helps explain why such light clouds our instruments in observing space, providing us with an additional factor to bring into the mix.
 

Rodrigo Zé do Cx Jr

Lenda da OS desde 2000
VIP
Mensagens
37.153
Reações
58.237
Pontos
2.009

Krion

Ei mãe, 500 pontos!
Mensagens
16.342
Reações
63.429
Pontos
903


Green Pea galaxy provides insights into early universe’s evolution

This is a Hubble Space Telescope image of the compact green pea galaxy J0925+1403. The diameter of the galaxy is approximately 6,000 light-years, so it is about twenty times smaller than the Milky Way. Image credit: NASA.
This is a Hubble Space Telescope image of the compact Green Pea galaxy J0925+1403. The diameter of the galaxy is approximately 6,000 light-years, so it is about twenty times smaller than the Milky Way. Image credit: NASA.Newly formed dwarf galaxies were likely the reason that the universe heated up about 13 billion years ago, according to new work by an international team of scientists that included a University of Virginia researcher. The finding opens an avenue for better understanding the early period of the universe’s 14-billion-year history.


In the period of several hundred thousand years after the Big Bang, the universe was so hot and dense that matter was ionised instead of being in a neutral form. But 380,000 years later, the expansion of the universe had cooled it enough for matter to become neutral and for the first structures of the universe to form — gas clouds of hydrogen and helium. Gravity then made these gas clouds grow in mass and collapse to form the first stars and galaxies. Then, about one billion years after the Big Bang, another important transformation occurred: the universe reheated, and hydrogen — the most abundant element — became ionised for a second time, as it had shortly after the Big Bang, an event which astronomers call “cosmic re-ionisation.” How this happened is still debated.

Astronomers have long thought that galaxies were responsible for this transformation.


University of Virginia Professor Trinh Thuan organised the international team of astronomers who made the discovery using data from the Hubble Space Telescope. Image credit: Dan Addison.

University of Virginia Professor Trinh Thuan organised the international team of astronomers who made the discovery using data from the Hubble Space Telescope. Image credit: Dan Addison.An international team of scientists, organised by University of Virginia astronomer Trinh Thuan in the United States, has largely validated that hypothesis in a paper published Thursday in the journal Nature. Trinh’s research colleagues on the paper are at institutions in Ukraine, the Czech Republic, Switzerland, France and Germany.


Using data from an ultraviolet spectrometer aboard the Hubble Space Telescope, the team discovered a nearby compact dwarf galaxy emitting a large number of ionising photons into the intergalactic medium, or the space between galaxies. Scientists believe those photons are responsible for the universe’s re-ionisation.

“This galaxy appears to be an excellent local analog of the numerous dwarf galaxies thought to be responsible for the reionisation of the early universe,” Trinh said. “The finding is significant because it gives us a good place to look for probing the reionisation phenomenon, which took place early in the formation of the universe that became the universe we have today.”

Normal matter in the early universe consisted mostly of gas. Stars and star clusters are born from clouds of gas, forming the first galaxies. Ultraviolet radiation emitted by these stars contains numerous ionising photons. For this reason, scientists have long suspected that galaxies were responsible for cosmic reionisation. However, for reionisation to occur, galaxies must eject these photons into the intergalactic medium; otherwise, they are easily absorbed by the gas and dust before they can escape. Despite 20 years of intensive searching, no galaxy emitting sufficient ionising radiation had been found, and the mechanism by which the universe became re-ionised remained a mystery.

To solve this problem, the international research team proposed to observe “green pea” galaxies. Discovered in 2007, these galaxies represent a special and rare class in the nearby universe. They appear green to light sensors and are round and compact, like a pea. They are believed to host stellar explosions or winds strong enough to eject ionising photons.

The team examined data from the Sloan Digital Sky Survey — a database of more than a million galaxies. From this survey, they identified approximately 5,000 galaxies that match their criteria: very compact galaxies emitting very intense UV radiation. Researchers selected five galaxies for observation with the Hubble Space Telescope.

Using Hubble’s UV radiation detecting capabilities, the research team found that the “green pea” galaxy J0925+1403, located at a distance of three billion light-years from Earth, was “ejecting” ionising photons, with an intensity never seen before — about an 8 percent ejection. This fundamental discovery shows that galaxies of this type could explain cosmic reionisation, confirming the most commonly made hypothesis for this phenomenon.

“As we make additional observations using Hubble, we expect to gain a much better understanding of the way photons are ejected from this type of galaxy, and the specific galaxy types driving cosmic reionisation,” Trinh said. “These are crucial observations in the process of stepping back in time to the early universe. They paved the way to future observations with the successor of Hubble, the James Webb Space Telescope, planned for launch in 2018, which is expected to revolutionise the field with updated capabilities for detailing the first galaxies and sources of cosmic re-ionisation.”
 

Vim do Futuro

Ei mãe, 500 pontos!
Mensagens
15.870
Reações
64.018
Pontos
553
De onde vem o carbono encontrado na Via Láctea?
Cientistas revelam quais estrelas podem ter sido as responsáveis por espalhar o elemento pela galáxia
E ainda podemos juntar as fábricas de estrelas no interior das galáxias. Um troço muito fantástico.
Depois temos os buracos negros, que, talvez, estejam reciclando matéria. Bem, aí é só uma teoria.
Aí, dependendo da perspectiva, podemos dizer que o universo é uma enorme planta industrial.
 

Krion

Ei mãe, 500 pontos!
Mensagens
16.342
Reações
63.429
Pontos
903
Passando para recomendar este video (para quem tem facilidade com a lingua inglesa),
de um dos meus físicos favoritos: Richard Feynman


Para quem não o conhece segue um excelente documentário (tem legendas em pt-br) sobre ele


Recomendo também estes excelentes livros dele publicados no :kcopa

51f-BNEDgy-KL-SX345-BO1-204-203-200.jpg
41e-ZAJAMq5-L-SX331-BO1-204-203-200.jpg
41-E2y83-W-DL-SX327-BO1-204-203-200.jpg
 

VinceVega

Condenado a ser livre!
VIP
Mensagens
5.260
Reações
9.518
Pontos
1.229
E ainda podemos juntar as fábricas de estrelas no interior das galáxias. Um troço muito fantástico.
Depois temos os buracos negros, que, talvez, estejam reciclando matéria. Bem, aí é só uma teoria.
Aí, dependendo da perspectiva, podemos dizer que o universo é uma enorme planta industrial.
Acho que nós somos os resíduos.
 

Vim do Futuro

Ei mãe, 500 pontos!
Mensagens
15.870
Reações
64.018
Pontos
553
Outro dia eu falei sobre a tal "fábrica de estrelas" no centro de nossa galáxia (e certamente das outras). Não é algo tão absurdo e já está sendo estudado detalhadamente. Mais um mistério para ser resolvido.
 

Krion

Ei mãe, 500 pontos!
Mensagens
16.342
Reações
63.429
Pontos
903
Scientists zoom in on ‘ghost galaxy’ for breakthrough discovery on supermassive black hole formation
14 Jul, 2020 15:47 / Updated 20 hours ago
Get short URL
Scientists zoom in on ‘ghost galaxy’ for breakthrough discovery on supermassive black hole formation

Illustration: © MARK GARLICK/SCIENCE PHOTO LIBRARY

Researchers investigating how supermassive black holes (SMBH) form have made a major breakthrough using some state of the art kit to zoom in on a nearby galaxy like never before.

The scientific community has long puzzled over how SMBHs form. Are they titans forged at the birth of the universe, with masses millions, if not billions, of times that of our Sun? Or are they merely mature versions of smaller ‘seed’ black holes that have grown so large by consuming everything around them?

To answer this very question, astronomers and astrophysicists have been hunting for the smallest mass SMBH they can find. One research team led by Cardiff University scientists thinks it’s pretty close, having employed a cutting-edge technique that allowed them to zoom in on their target SMBH.


“The SMBH in Mirach’s Ghost appears to have a mass within the range predicted by ‘direct collapse’ models,” said Dr. Tim Davis from Cardiff University’s School of Physics and Astronomy. In other words, the SMBHs are titans from the early universe.
“Mirach’s Ghost” is actually a nearby galaxy, so called on account of its proximity to the star Mirach, whose light gives the galaxy an ethereal glow. One of the lowest-mass SMBHs yet discovered, it is located in the heart of a nearby galaxy and has a mass just shy of one million times that of our own star.

Describing the SMBH as “currently active and swallowing gas,” Davis says that while this isn’t a definitive answer one way or the other, it does strongly suggest that SMBHs formed in the early universe and did not grow from smaller black holes.

The current prevailing theory is that there is an SMBH at the heart of nearly all large galaxies in the universe, including our own Milky Way.
Using the Atacama Large Millimeter/submillimeter Array (ALMA) in Chile, along with these cutting edge zoom techniques, which can reveal details only 1.5 light years across in distant galaxies, scientists are gaining a much more detailed picture of the universe around us and how it formed.
 

Krion

Ei mãe, 500 pontos!
Mensagens
16.342
Reações
63.429
Pontos
903
Foi esse tipo de imagem, que compara corpos celestes, que fez eu me apaixonar por astronomia.


Este abaixo, comparando o tamanho de algumas das maiores estrelas conhecidas (apesar de ser um pouco "antigo") também é muito bom

(só clicar nas imagens para as versões originais em ".png" de alta resolução)


Este vídeo um pouco mais recente, tem uma comparação animada, que dar para ter uma melhor noção destas escalas titânicas


quemsoueu

Mil pontos, LOL!
Mensagens
15.524
Reações
13.647
Pontos
1.409
lá pro fim de semana que vem tem chances do cometa neowise ser visto aqui pro sul do país, aqui onde moro é vale acho que não rola já que ele se mostra bem baixo no horizonte.
 

Krion

Ei mãe, 500 pontos!
Mensagens
16.342
Reações
63.429
Pontos
903
Largest 3D map of the universe ever created


The Sloan Digital Sky Survey (SDSS) released today a comprehensive analysis of the largest three-dimensional map of the universe ever created. At the heart of the new results are detailed measurements of more than two million galaxies and quasars covering 11 billion years of cosmic time.

“We know both the ancient history of the universe and its recent expansion history fairly well, but there’s been a troublesome gap in the middle 11 billion years,” said cosmologist Kyle Dawson of the University of Utah, who led the team announcing today’s results. “For five years, we have worked to fill in that gap, and we are using that information to provide some of the most substantial advances in cosmology in the last decade.”

The results come from the extended Baryon Oscillation Spectroscopic Survey (eBOSS), an international collaboration of more than 100 astrophysicists that is one of the SDSS’s component surveys.

We know what the universe looked like in its infancy thanks to thousands of scientists from around the world who have measured the relative amounts of elements created soon after the Big Bang, and who have studied the Cosmic Microwave Background. We also know its expansion history over the last few billion years from galaxy maps and distance measurements, including those from previous phases of the SDSS.

“The analyses have also provided measurements on how the diverse structures in the universe grow over time,” says Zheng Zheng, professor of physics and astronomy at the University of Utah. “The story underneath the structure growth is amazingly consistent with what we learn from the expansion history.”

A bowtie-shaped spectral of lights representing the universe. The center is bright green, then radiates the hot pink, magenta, yellow, and then white and finally gray.
PHOTO CREDIT: Anand Raichoor (EPFL), Ashley Ross (Ohio State University) and SDSS
The SDSS map is shown as a rainbow of colors, located within the observable universe (the outer sphere, showing fluctuations in the Cosmic Microwave Background). We are located at the center of this map. The inset for each color-coded section of the map includes an image of a typical galaxy or quasar from that section, and also the signal of the pattern that the eBOSS team measures there. The bump visible in each panel is at the characteristic scale of about 500 million lightyears. As we look out in distance, we look back in time. So, the location of these signals reveals the expansion rate of the universe at different times in cosmic history.
The final map is shown in the accompanying image. A close look reveals the filaments and voids that define the structure in the universe, starting from the time when it was only about 300,000 years old. From this map, researchers measured patterns in the distribution of galaxies, which gave several key parameters of the universe to better than 1% accuracy. The signals of these patterns are shown in the insets in the accompanying image.

The map represents the combined effort of hundreds of scientists mapping the universe using the Sloan Foundation telescope for nearly twenty years. The cosmic history showed that about six billion years ago, the expansion of the universe began to accelerate, and has continued to get faster and faster ever since. This accelerated expansion seems to be due to a mysterious invisible component of the universe called “dark energy,” consistent with Einstein’s General Theory of Relativity, but extremely difficult to reconcile with our current understanding of particle physics.

Combining observations from eBOSS with studies of the universe in its infancy revealed cracks in this picture of the universe. In particular, the eBOSS team’s measurement of the current rate of expansion of the universe (the “Hubble Constant”) was about 10% lower than the value found from distances to nearby galaxies. The high precision of the eBOSS data means that it is highly unlikely that this mismatch was due to chance, and the rich variety of eBOSS data gave us multiple independent ways to draw the same conclusion.

“Imprinted in the galaxy or quasar distribution is a particular pattern that serves as a ruler,” said Zheng. “With eBOSS maps, such a ruler has achieved its best-ever performance and enabled us to measure distances with unprecedented precision, which makes it possible to most clearly reveal the mismatch in the Hubble Constant.”

There is no broadly accepted explanation for this discrepancy in measured expansion rates, but one exciting possibility is that a previously-unknown form of matter or energy from the early universe might have left a trace on our history.

In total, the eBOSS team made the results from more than 20 scientific papers public today. Those papers describe, in more than 500 pages, the team’s analyses of the latest eBOSS data, marking the completion of the key goals of the survey.

The University of Utah has been a key contributor to SDSS over the last decade. The massive samples of spectroscopic data that went into the final eBOSS cosmological result were processed and located at the U, within the Science Archive Server hosted by the U’s Center for High-Performance Computing.


“We have made a series of developments in the data analysis, leading to greater precision in the cosmological map. This team effort was made possible by our cutting edge science archive system. The final eBOSS data products will remain a legacy, helpful to a broad range of users, from young students to amateur and professional astronomers,” says SDSS-IV science archive scientist Joel Brownstein, research associate professor at the U.

Within the eBOSS team, individual groups at universities around the world focused on different aspects of the analysis. To create the part of the map dating back six billion years, the team used large, red galaxies. Farther out, they used younger, blue galaxies. Finally, to map the universe eleven billion years in the past and more, they used quasars, which are bright galaxies lit up by material falling onto a central supermassive black hole. Each of these samples required careful analysis in order to remove noise, and reveal the patterns of the universe.

“The SDSS data allow unique insights into the evolutionary history of our universe” says Dawson. “Using these data, along with data from the Cosmic Microwave Background and supernovae, we have made the largest advances of any experiment in the last decade to determine the intrinsic curvature of space. We have explored the energy contents of the universe, the laws of gravity, and the physics of some of the smallest particles, the neutrinos, and now have a model for these components that allows us to estimate the local expansion rate to 1% precision.”

eBOSS, and SDSS more generally, leaves the puzzle of dark energy, and the mismatch of local and early universe expansion rate, as a legacy to future projects. In the next decade, future surveys may resolve the conundrum, or perhaps, will reveal more surprises.

Meanwhile, the SDSS is nowhere near done with its mission to understand the Universe. Gail Zasowski, the spokesperson for the next generation of SDSS, described her excitement for the next steps.

“We’re upgrading the hardware and instruments needed to keep the tremendous impact of SDSS going into the 2020s. We’ll be focusing on the history of our own Milky Way Galaxy, the architecture of multi-star and planetary systems, how galaxies make their stars, and how black holes grow over the lifetime of the Universe. These are some of the most exciting questions in astrophysics, and we’re looking forward to the next decades of discovery!”
 

Rodrigo Zé do Cx Jr

Lenda da OS desde 2000
VIP
Mensagens
37.153
Reações
58.237
Pontos
2.009
Largest 3D map of the universe ever created


The Sloan Digital Sky Survey (SDSS) released today a comprehensive analysis of the largest three-dimensional map of the universe ever created. At the heart of the new results are detailed measurements of more than two million galaxies and quasars covering 11 billion years of cosmic time.

“We know both the ancient history of the universe and its recent expansion history fairly well, but there’s been a troublesome gap in the middle 11 billion years,” said cosmologist Kyle Dawson of the University of Utah, who led the team announcing today’s results. “For five years, we have worked to fill in that gap, and we are using that information to provide some of the most substantial advances in cosmology in the last decade.”

The results come from the extended Baryon Oscillation Spectroscopic Survey (eBOSS), an international collaboration of more than 100 astrophysicists that is one of the SDSS’s component surveys.

We know what the universe looked like in its infancy thanks to thousands of scientists from around the world who have measured the relative amounts of elements created soon after the Big Bang, and who have studied the Cosmic Microwave Background. We also know its expansion history over the last few billion years from galaxy maps and distance measurements, including those from previous phases of the SDSS.

“The analyses have also provided measurements on how the diverse structures in the universe grow over time,” says Zheng Zheng, professor of physics and astronomy at the University of Utah. “The story underneath the structure growth is amazingly consistent with what we learn from the expansion history.”

A bowtie-shaped spectral of lights representing the universe. The center is bright green, then radiates the hot pink, magenta, yellow, and then white and finally gray.
PHOTO CREDIT: Anand Raichoor (EPFL), Ashley Ross (Ohio State University) and SDSS
The SDSS map is shown as a rainbow of colors, located within the observable universe (the outer sphere, showing fluctuations in the Cosmic Microwave Background). We are located at the center of this map. The inset for each color-coded section of the map includes an image of a typical galaxy or quasar from that section, and also the signal of the pattern that the eBOSS team measures there. The bump visible in each panel is at the characteristic scale of about 500 million lightyears. As we look out in distance, we look back in time. So, the location of these signals reveals the expansion rate of the universe at different times in cosmic history.
The final map is shown in the accompanying image. A close look reveals the filaments and voids that define the structure in the universe, starting from the time when it was only about 300,000 years old. From this map, researchers measured patterns in the distribution of galaxies, which gave several key parameters of the universe to better than 1% accuracy. The signals of these patterns are shown in the insets in the accompanying image.

The map represents the combined effort of hundreds of scientists mapping the universe using the Sloan Foundation telescope for nearly twenty years. The cosmic history showed that about six billion years ago, the expansion of the universe began to accelerate, and has continued to get faster and faster ever since. This accelerated expansion seems to be due to a mysterious invisible component of the universe called “dark energy,” consistent with Einstein’s General Theory of Relativity, but extremely difficult to reconcile with our current understanding of particle physics.

Combining observations from eBOSS with studies of the universe in its infancy revealed cracks in this picture of the universe. In particular, the eBOSS team’s measurement of the current rate of expansion of the universe (the “Hubble Constant”) was about 10% lower than the value found from distances to nearby galaxies. The high precision of the eBOSS data means that it is highly unlikely that this mismatch was due to chance, and the rich variety of eBOSS data gave us multiple independent ways to draw the same conclusion.

“Imprinted in the galaxy or quasar distribution is a particular pattern that serves as a ruler,” said Zheng. “With eBOSS maps, such a ruler has achieved its best-ever performance and enabled us to measure distances with unprecedented precision, which makes it possible to most clearly reveal the mismatch in the Hubble Constant.”

There is no broadly accepted explanation for this discrepancy in measured expansion rates, but one exciting possibility is that a previously-unknown form of matter or energy from the early universe might have left a trace on our history.

In total, the eBOSS team made the results from more than 20 scientific papers public today. Those papers describe, in more than 500 pages, the team’s analyses of the latest eBOSS data, marking the completion of the key goals of the survey.

The University of Utah has been a key contributor to SDSS over the last decade. The massive samples of spectroscopic data that went into the final eBOSS cosmological result were processed and located at the U, within the Science Archive Server hosted by the U’s Center for High-Performance Computing.


“We have made a series of developments in the data analysis, leading to greater precision in the cosmological map. This team effort was made possible by our cutting edge science archive system. The final eBOSS data products will remain a legacy, helpful to a broad range of users, from young students to amateur and professional astronomers,” says SDSS-IV science archive scientist Joel Brownstein, research associate professor at the U.

Within the eBOSS team, individual groups at universities around the world focused on different aspects of the analysis. To create the part of the map dating back six billion years, the team used large, red galaxies. Farther out, they used younger, blue galaxies. Finally, to map the universe eleven billion years in the past and more, they used quasars, which are bright galaxies lit up by material falling onto a central supermassive black hole. Each of these samples required careful analysis in order to remove noise, and reveal the patterns of the universe.

“The SDSS data allow unique insights into the evolutionary history of our universe” says Dawson. “Using these data, along with data from the Cosmic Microwave Background and supernovae, we have made the largest advances of any experiment in the last decade to determine the intrinsic curvature of space. We have explored the energy contents of the universe, the laws of gravity, and the physics of some of the smallest particles, the neutrinos, and now have a model for these components that allows us to estimate the local expansion rate to 1% precision.”

eBOSS, and SDSS more generally, leaves the puzzle of dark energy, and the mismatch of local and early universe expansion rate, as a legacy to future projects. In the next decade, future surveys may resolve the conundrum, or perhaps, will reveal more surprises.

Meanwhile, the SDSS is nowhere near done with its mission to understand the Universe. Gail Zasowski, the spokesperson for the next generation of SDSS, described her excitement for the next steps.

“We’re upgrading the hardware and instruments needed to keep the tremendous impact of SDSS going into the 2020s. We’ll be focusing on the history of our own Milky Way Galaxy, the architecture of multi-star and planetary systems, how galaxies make their stars, and how black holes grow over the lifetime of the Universe. These are some of the most exciting questions in astrophysics, and we’re looking forward to the next decades of discovery!”

Pois então, tem várias discussões sobre o formato do universo, mas não lembro de em alguma delas se considerar esse formato de "ampulheta", que pra mim seria o mais lógico considerando o big bang.
 

Krion

Ei mãe, 500 pontos!
Mensagens
16.342
Reações
63.429
Pontos
903
Pois então, tem várias discussões sobre o formato do universo, mas não lembro de em alguma delas se considerar esse formato de "ampulheta", que pra mim seria o mais lógico considerando o big bang.


Aqui tem um video curto ilustrando melhor o novo mapa 3D do universo que geraram
(Cada vez mais com a melhoria da tecnologia e novos telescópios (e sensores) logo logo devemos ter um mapa ainda mais detalhado que o atual)


The final map is shown in the image above. A close look at the map reveals the filaments and voids that define the structure in the Universe, starting from the time when the Universe was only about 300,000 years old. From this map, researchers measure patterns in the distribution of galaxies, which give several key parameters of our Universe to better than one percent accuracy. The signals of these patterns are shown in the insets in the image.
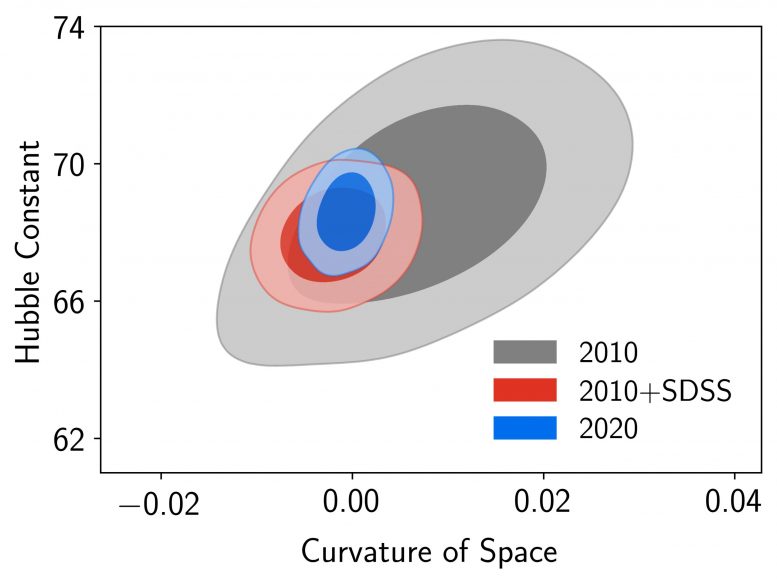
Current Expansion Rate and Curvature of the Universe
This image illustrates the impact that the eBOSS and SDSS maps have had on our understanding of the current expansion rate and curvature of the Universe from the last 20 years of work.
The gray region shows our knowledge as of 10 years ago. The blue region shows the best current measurement, which combines SDSS and other programs. The decreasing sizes of the colored regions show how our knowledge of the expansion rate has improved.
The contribution of the SDSS data to this improvement is shown by the red region. The measurements of the curvature of the Universe are shown on the horizontal axis. The SDSS results, which hone in on zero, suggest the Universe is flat, and improve significantly on constraints from other experiments. The vertical axis shows the current expansion rate of the Universe (the Hubble Constant). The Hubble Constant measurements from SDSS and other surveys are inconsistent with the measurements from nearby galaxies, which find a value close to 74 in these units – as opposed to 68 for the SDSS. Only with the data taken from SDSS and other experiments in the last decade has it been possible to reveal this discrepancy.
Credit: Eva-Maria Mueller (Oxford University) and the SDSS Collaboration


This map represents the combined effort of more than 20 years of mapping the Universe using the Sloan Foundation telescope. The cosmic history that has been revealed in this map shows that about six billion years ago, the expansion of the Universe began to accelerate, and has continued to get faster and faster ever since. This accelerated expansion seems to be due to a mysterious invisible component of the Universe called “dark energy,” consistent with Einstein’s General Theory of Relativity but extremely difficult to reconcile with our current understanding of particle physics.
 

Krion

Ei mãe, 500 pontos!
Mensagens
16.342
Reações
63.429
Pontos
903
A matéria da FORBES sobre o assunto, tem mais alguns dados interessantes

Record-Breaking 3D Map Of The Universe Reveals Some Big Surprises
Starts With A Bang
Ethan SiegelSenior Contributor

The Sloan Digital Sky Survey's view of the deep, distant Universe.

The history of the Universe, as far back as we can see using a variety of tools and telescopes, out ... [+]
SLOAN DIGITAL SKY SURVEY (SDSS)

What is the Universe made of? How quickly is it expanding today, and how does that expansion rate change over time? If we could know the answers to these questions, we’d understand both the past history and future fate of our Universe. Yet even with our best measurements of the Universe itself, different methods don’t give the same answer. Measuring the Big Bang’s leftover glow, the cosmic microwave background, gives us one set of answers, while measuring stars, galaxies, and supernovae gives us a different, incompatible answer. The discrepancy is, arguably, the biggest conundrum in modern cosmology.

But with more than two decades of data — and a detailed, 3D map of more than 2 million galaxies — the Sloan Digital Sky Survey might help us finally solve this cosmic mystery. These galaxies are spread out over more than 19 billion light-years in all directions, corresponding to more than 11 billion years of cosmic history in our expanding Universe. But what is it made out of? How quickly is it expanding today? What else have we learned, and what comes next for astrophysics? Here’s the remarkable story.

The history of our Universe condensed into a single graph.

The expanding Universe, full of galaxies and the complex structure we observe today, arose from a ... [+]
C. FAUCHER-GIGUÈRE, A. LIDZ, AND L. HERNQUIST, SCIENCE 319, 5859 (47)

Imagine the Universe, if you can, in the early stages of the hot Big Bang. Over the first few minutes, nuclear fusion can occur between subatomic particles, creating light elements like various isotopes of hydrogen and helium. Over the subsequent years, gravitation works to to pull matter — both normal matter and dark matter — into the regions of greatest density, while radiation pushes back differently on the normal matter (which it interacts with) than the dark matter (which it doesn’t).

This effect, of getting pulled in by gravity but pushed out by other interactions, creates wave-like effects in the density of normal matter. Billions of years later, after the Universe expands and forms stars and galaxies, these waves can still be seen: they’re imprinted in the Universe itself. If you put your finger down on any random galaxy and ask the question, “how likely am I to find another galaxy a certain distance away,” you should actually be able to map out not only the impact of these waves, but you can see how that impact changes as the Universe expands.

Astronomers use standard candles and standard rulers to measure the expanding Universe.

Standard candles (L) and standard rulers (R) are two different techniques astronomers use to measure ... [+]
NASA/JPL-CALTECH

In our nearby Universe, for example, which has been expanding for 13.8 billion years since the Big Bang, we’ve measured how galaxies cluster together. You can imagine starting at a galaxy and setting down an invisible “ruler” to measure the distance between that galaxy and every other galaxy you can find. On average, you’ll discover that:

  • you’re likely to find a galaxy close to your own, because gravity is attractive,
  • as you move farther away, you’re (gradually) less likely to find another galaxy,
  • until you run into that “wave” feature imprinted in the very early Universe.

It means that, today, if you drew a smooth curve that represented how likely you’d be to find another galaxy, the wave feature means that you’re actually more likely to find a galaxy that’s 500 million light-years away than you’d anticipate, but less likely to find one 400 million or 600 million light-years away.
This imprint has a name: baryon acoustic oscillations, because it’s the normal matter (baryons) imprinting pressure waves (acoustic oscillations) on the large-scale structure of the Universe.

Baryon acoustic oscillations imprinted in the clustering of galaxies.

An illustration of clustering patterns due to Baryon Acoustic Oscillations, where the likelihood of ... [+]
ZOSIA ROSTOMIAN
It’s one thing to calculate the effect, which we can do from a theoretical perspective. It’s another thing to measure the effect nearby, which the Sloan Digital Sky Survey has been doing since it began science operations in 1998. But it’s a giant leap to measure it all throughout the Universe, over the majority of our cosmic history, which is what the latest release has just accomplished.
The reason is simple: the size of the acoustic scale stretches to be longer and longer as the Universe expands.
In other words, if you can map out the galaxies in the Universe not just nearby, but far away as well, you can measure how the Universe has expanded over time. There are a lot of challenges that get in the way, including:

  • it’s harder to see distant galaxies because they’re fainter,
  • it’s harder to resolve individual galaxies that are close to one another,
  • it’s hard to map out distance in the third (depth) dimension,
  • and that other effects can come into play, biasing our conclusions.

A simple example of bias can be seen just by looking at the closest galaxy cluster to Earth: the Virgo cluster.
The galaxies of the Virgo cluster as imaged with a modern amateur setup.

The galaxies of the Virgo Cluster are all between 50 and 60 million light-years away, but some of ... [+]
JOHN BOWLES / FLICKR / CC-BY-SA 2.0
The Virgo cluster is a large collection of galaxies — more than 1,000 of them — that’s located between about 50 and 60 million light-years away. There are few measurements we can take to help us understand how distant a galaxy is: we can measure its brightness, we can measure its apparent size, and we can measure its redshift. The redshift measurement is an important component, since it tells us how fast this object appears to be receding from us, an important component of understanding how the Universe has expanded.

But there are two causes for the redshift of any particular galaxy: the large-scale cosmic expansion, which affects all galaxies equally, and the effects of gravitation. When you have a large collection of mass, like a galaxy cluster, it causes the individual galaxies within it to move around very quickly, including along our line-of-sight direction. Astronomers call this peculiar motion, which gets superimposed atop the expanding Universe. If we were to plot out where galaxies are and ignored this effect, we’d see that their inferred positions were incorrect.
The first plots, in fact, that saw this effect led to a very catchy name for these redshift-space distortions: Fingers of God.
FOGs, or Fingers of God, are known to appear in redshift space.

FOGs, or Fingers of God, are known to appear in redshift space. Because galaxies in clusters can get ... [+]
TEGMARK, M., ET AL. 2004, APJ, 606, 702

But with a good enough understanding of the Universe, we can correct for this effect, and transform our maps from “redshift space,” which is biased, to “real space,” where that bias is removed. The latest results from the Sloan Digital Sky Survey not only utilize an unprecedentedly large number of galaxies over the largest distance span ever, they also employ the full suite of corrections that we know how to make in modern cosmology. We can be more confident than ever before that the Universe, as we’re seeing it, is a reflection of how it actually is.

As far as data goes, we’ve never had anything like this before. Within the most recent 2 billion years, we have light from nearby galaxies, mapped during the first decade of the Sloan Digital Sky Survey (1998-2008). Beyond that, we have old red galaxies that take us out from 2 to 7 billion years in the past. Beyond that, there are young blue galaxies from 6-to-8 billion years ago, with quasars extending from about 7 billion years ago all the way to 11 billion years ago. Even beyond that, from 11 billion years to just over 12 billion years ago, we have a sample of galaxies that emits light from its hydrogen atoms, which take us to earlier times than ever as far as structure formation is concerned.

The SDSS map is shown as a rainbow of colors, located within the observable Universe.

The SDSS map is shown as a rainbow of colors, located within the observable Universe (the outer ... [+]
ANAND RAICHOOR (EPFL), ASHLEY ROSS (OHIO STATE UNIVERSITY) AND THE SDSS COLLABORATION

According to Will Percival, the Survey Scientist for the extended Baryon Oscillation Spectroscopic Survey (eBOSS) project, "Taken together, detailed analyses of the eBOSS map and the earlier SDSS experiments have now provided the most accurate expansion history measurements over the widest-ever range of cosmic time. These studies allow us to connect all these measurements into a complete story of the expansion of the Universe."

And yet, the story that we learn is comforting in many ways — as it confirms, independently, a number of things we thought were true — but it sheds a surprising light on many aspects of the Universe.

The non-surprising results are extremely important. For one, they found that dark energy is incredibly consistent with a cosmological constant: there’s no good evidence that it evolves with time or varies through space. Its energy density remains constant over time. Another exciting confirmation is that the Universe is incredibly spatially flat: its maximum allowable curvature is just 0.2% of the critical density, a constraint that’s 20 times stronger than last year’s controversial claim that the Universe might be closed instead of flat.

Constraints on curvature from the large-scale structure of the Universe from SDSS.

The 3D reconstruction of 120,000 galaxies and their clustering properties from the Sloan Digital Sky ... [+]
JEREMY TINKER AND THE SDSS-III COLLABORATION

There are other unsurprising results that represent incremental improvements in our understanding as well. We still haven’t seen an imprint of neutrinos in the large-scale structure of the Universe, constraining their total mass (of the electron, muon, and tau neutrinos combined) to be less than 0.11 eV, meaning that the electron must be at least 4.6 million times heavier than all three neutrino masses combined. They find a Universe that’s 70% dark energy and 30% total matter (normal matter and dark matter combined), with an uncertainty of only ~1% on both figures.

But the biggest surprising result comes from the attempt to measure the expansion rate of the Universe. Remember, there’s an enormous controversy over this, as teams that measure the distances to objects individually (known as the “distance ladder” method) consistently get values of 72-75 km/s/Mpc, but teams that use the Cosmic Microwave Background consistently get values between 66-68 km/s/Mpc.
Without appealing to either of those other two data sets, the best results from this latest study yield an expansion rate of 68.2 km/s/Mpc, robustly requiring a Universe with dark energy.

The combined constraints of baryon acoustic oscillations with nucleosynthesis data.

When you combine data from baryon acoustic oscillations (blue swath) with data from the abundances ... [+]
EVA-MARIA MUELLER (OXFORD UNIVERSITY) AND THE SDSS COLLABORATION

But there’s a catch. You have to provide a value, at some point, that answers the question of “how big was the Universe at this particular time?” You can do that exquisitely with data from the Cosmic Microwave Background, which is the narrow grey ellipsoid on the above graph. But doing so would defeat the purpose of having an independent data set, just as using the “distance ladder” ellipsoid (in purple) would defeat having an independent data set.

That’s why the team used data from BBN: Big Bang Nucleosynthesis. By measuring the abundances of various hydrogen and helium isotopes created shortly after the Big Bang, we can get a constraint for the expansion rate that doesn’t depend on anyone else’s measurements for it. Even though there remains some wiggle-room, it’s very clear that this data favors the lower expansion rate from the Cosmic Microwave Background. This doesn’t solve our cosmic conundrum over how fast the Universe is expanding, but deepens it, adding a remarkable new data set into the camp favoring a lower rate for its value.

Various values for the derived expansion rate of the Universe using different data.

A series of different groups seeking to measure the expansion rate of the Universe, along with their ... [+]
L. VERDE, T. TREU, AND A.G. RIESS (2019), ARXIV:1907.10625

The Universe is not curved on the largest scales, but is spatially flat to 499 parts in 500: the tightest constraint ever. The Universe not only needs dark energy, but it makes up 70% of the Universe and is perfectly consistent with a cosmological constant. Of the other 30%, 25% is dark matter and just 5% is normal matter, with the Universe expanding at 68.2 km/s/Mpc. This is based on over 2 million galaxies observed from nearby to in excess of 19 billion light-years away, corresponding to more than 11 billion years of cosmic history.

In the coming years, the Dark Energy Spectroscopic Instrument (DESI) will take us to tens of millions of galaxies, with even greater advances coming with the launch of ESA's Euclid, NASA's WFIRST, and the NSF's ground-based Vera Rubin Observatory. There are now three major players in the quest to measure the expansion of the
Universe: the Cosmic Microwave Background, the cosmic distance ladder, and the imprint of acoustic oscillations in the Universe’s large-scale structure. The first and third methods agree with each other, but not with the second. Until we figure out why, along with the puzzles of dark matter and dark energy, this will remain one of the most compelling mysteries about the very nature of our cosmos.
 

Vim do Futuro

Ei mãe, 500 pontos!
Mensagens
15.870
Reações
64.018
Pontos
553
Mudando um pouco o rumo da prosa.... Outro dia eu estava vendo um daqueles vídeos sobre o possível planeta X. Tudo bem que muitos astrônomos cogitam o tal planeta para explicar o comportamento dos objetos (planetoides) do cinturão de Kuiper. Ok.
Não tenho o menor conhecimento técnico para teorizar sobre o fenômeno. Mas... Sei lá, acho meio absurdo haver um planeta gigante e com uma órbita tão excêntrica e tão distante da sua estrela. Primeiro que ele seria (ou deveria ser) gelado e não gasoso como os planetas gigantes. Depois, olhando a região, só temos observado planetas anões e asteroides. Nenhum corpo conseguiu massa/tamanho para imaginarmos que um eventual planeta gigante poderia se originar pra lá do cinturão. A sua provável órbita também é um troço de maluco. Totalmente surreal.
(Ah, apesar da história ser engraçadinha e divertida, não estou falando de Nibiru. Aí é bizarro demais pra aceitar.)

Uma outra teoria é que haveria um micro buraco negro nos confins do sistema solar. Mas isso também é só uma teoria.Eu nunca soube de alguma evidência mais concreta disso ser real.

Então, alguém imagina algo ou tem uma teoria sobre o assunto?
 

Krion

Ei mãe, 500 pontos!
Mensagens
16.342
Reações
63.429
Pontos
903
Mudando um pouco o rumo da prosa.... Outro dia eu estava vendo um daqueles vídeos sobre o possível planeta X. Tudo bem que muitos astrônomos cogitam o tal planeta para explicar o comportamento dos objetos (planetoides) do cinturão de Kuiper. Ok.
Não tenho o menor conhecimento técnico para teorizar sobre o fenômeno. Mas... Sei lá, acho meio absurdo haver um planeta gigante e com uma órbita tão excêntrica e tão distante da sua estrela. Primeiro que ele seria (ou deveria ser) gelado e não gasoso como os planetas gigantes. Depois, olhando a região, só temos observado planetas anões e asteroides. Nenhum corpo conseguiu massa/tamanho para imaginarmos que um eventual planeta gigante poderia se originar pra lá do cinturão. A sua provável órbita também é um troço de maluco. Totalmente surreal.
(Ah, apesar da história ser engraçadinha e divertida, não estou falando de Nibiru. Aí é bizarro demais pra aceitar.)

Uma outra teoria é que haveria um micro buraco negro nos confins do sistema solar. Mas isso também é só uma teoria.Eu nunca soube de alguma evidência mais concreta disso ser real.

Então, alguém imagina algo ou tem uma teoria sobre o assunto?


Que tem "algo" lá é quase fato (se é um planeta ou um "mini buraco negro"),
Tem este paper sobre o assunto (talvez o mais completo até agora), publicado no "The Astronomical Journal", com alguns dados (mas é bem técnico)

EVIDENCE FOR A DISTANT GIANT PLANET IN THE SOLAR SYSTEM


Além deste artigo muito bom da Caltech (Instituto de Tecnologia da Califórnia) baseado no paper acima

Caltech Researchers Find Evidence of a Real Ninth Planet
January 20, 2016
Caltech researchers have found evidence of a giant planet tracing a bizarre, highly elongated orbit in the outer solar system. The object, which the researchers have nicknamed Planet Nine, has a mass about 10 times that of Earth and orbits about 20 times farther from the sun on average than does Neptune (which orbits the sun at an average distance of 2.8 billion miles). In fact, it would take this new planet between 10,000 and 20,000 years to make just one full orbit around the sun.
The researchers, Konstantin Batygin and Mike Brown, discovered the planet's existence through mathematical modeling and computer simulations but have not yet observed the object directly.

"This would be a real ninth planet," says Brown, the Richard and Barbara Rosenberg Professor of Planetary Astronomy. "There have only been two true planets discovered since ancient times, and this would be a third. It's a pretty substantial chunk of our solar system that's still out there to be found, which is pretty exciting."
Brown notes that the putative ninth planet—at 5,000 times the mass of Pluto—is sufficiently large that there should be no debate about whether it is a true planet.
Unlike the class of smaller objects now known as dwarf planets, Planet Nine gravitationally dominates its neighborhood of the solar system. In fact, it dominates a region larger than any of the other known planets—a fact that Brown says makes it "the most planet-y of the planets in the whole solar system."
Batygin and Brown describe their work in the current issue of the Astronomical Journal and show how Planet Nine helps explain a number of mysterious features of the field of icy objects and debris beyond Neptune known as the Kuiper Belt.

"Although we were initially quite skeptical that this planet could exist, as we continued to investigate its orbit and what it would mean for the outer solar system, we become increasingly convinced that it is out there," says Batygin, an assistant professor of planetary science. "For the first time in over 150 years, there is solid evidence that the solar system's planetary census is incomplete."

The road to the theoretical discovery was not straightforward. In 2014, a former postdoc of Brown's, Chad Trujillo, and his colleague Scott Sheppard published a paper noting that 13 of the most distant objects in the Kuiper Belt are similar with respect to an obscure orbital feature. To explain that similarity, they suggested the possible presence of a small planet. Brown thought the planet solution was unlikely, but his interest was piqued.

He took the problem down the hall to Batygin, and the two started what became a year-and-a-half-long collaboration to investigate the distant objects. As an observer and a theorist, respectively, the researchers approached the work from very different perspectives—Brown as someone who looks at the sky and tries to anchor everything in the context of what can be seen, and Batygin as someone who puts himself within the context of dynamics, considering how things might work from a physics standpoint. Those differences allowed the researchers to challenge each other's ideas and to consider new possibilities. "I would bring in some of these observational aspects; he would come back with arguments from theory, and we would push each other. I don't think the discovery would have happened without that back and forth," says Brown. " It was perhaps the most fun year of working on a problem in the solar system that I've ever had."

Fairly quickly Batygin and Brown realized that the six most distant objects from Trujillo and Sheppard's original collection all follow elliptical orbits that point in the same direction in physical space. That is particularly surprising because the outermost points of their orbits move around the solar system, and they travel at different rates.

"It's almost like having six hands on a clock all moving at different rates, and when you happen to look up, they're all in exactly the same place," says Brown. The odds of having that happen are something like 1 in 100, he says. But on top of that, the orbits of the six objects are also all tilted in the same way—pointing about 30 degrees downward in the same direction relative to the plane of the eight known planets. The probability of that happening is about 0.007 percent. "Basically it shouldn't happen randomly," Brown says. "So we thought something else must be shaping these orbits."

The first possibility they investigated was that perhaps there are enough distant Kuiper Belt objects—some of which have not yet been discovered—to exert the gravity needed to keep that subpopulation clustered together. The researchers quickly ruled this out when it turned out that such a scenario would require the Kuiper Belt to have about 100 times the mass it has today.

That left them with the idea of a planet. Their first instinct was to run simulations involving a planet in a distant orbit that encircled the orbits of the six Kuiper Belt objects, acting like a giant lasso to wrangle them into their alignment. Batygin says that almost works but does not provide the observed eccentricities precisely. "Close, but no cigar," he says.

Then, effectively by accident, Batygin and Brown noticed that if they ran their simulations with a massive planet in an anti-aligned orbit—an orbit in which the planet's closest approach to the sun, or perihelion, is 180 degrees across from the perihelion of all the other objects and known planets—the distant Kuiper Belt objects in the simulation assumed the alignment that is actually observed.

"Your natural response is 'This orbital geometry can't be right. This can't be stable over the long term because, after all, this would cause the planet and these objects to meet and eventually collide,'" says Batygin. But through a mechanism known as mean-motion resonance, the anti-aligned orbit of the ninth planet actually prevents the Kuiper Belt objects from colliding with it and keeps them aligned. As orbiting objects approach each other they exchange energy. So, for example, for every four orbits Planet Nine makes, a distant Kuiper Belt object might complete nine orbits. They never collide. Instead, like a parent maintaining the arc of a child on a swing with periodic pushes, Planet Nine nudges the orbits of distant Kuiper Belt objects such that their configuration with relation to the planet is preserved.
"Still, I was very skeptical," says Batygin. "I had never seen anything like this in celestial mechanics."

But little by little, as the researchers investigated additional features and consequences of the model, they became persuaded. "A good theory should not only explain things that you set out to explain. It should hopefully explain things that you didn't set out to explain and make predictions that are testable," says Batygin.

And indeed Planet Nine's existence helps explain more than just the alignment of the distant Kuiper Belt objects. It also provides an explanation for the mysterious orbits that two of them trace. The first of those objects, dubbed Sedna, was discovered by Brown in 2003. Unlike standard-variety Kuiper Belt objects, which get gravitationally "kicked out" by Neptune and then return back to it, Sedna never gets very close to Neptune. A second object like Sedna, known as 2012 VP113, was announced by Trujillo and Sheppard in 2014. Batygin and Brown found that the presence of Planet Nine in its proposed orbit naturally produces Sedna-like objects by taking a standard Kuiper Belt object and slowly pulling it away into an orbit less connected to Neptune.

Predicted consequence of Planet 9


A predicted consequence of Planet Nine is that a second set of confined objects should also exist. These objects are forced into positions at right angles to Planet Nine and into orbits that are perpendicular to the plane of the solar system. Five known objects (blue) fit this prediction precisely.Credit: Caltech/R. Hurt (IPAC) [Diagram was created using WorldWide Telescope.]

But the real kicker for the researchers was the fact that their simulations also predicted that there would be objects in the Kuiper Belt on orbits inclined perpendicularly to the plane of the planets. Batygin kept finding evidence for these in his simulations and took them to Brown. "Suddenly I realized there are objects like that," recalls Brown. In the last three years, observers have identified four objects tracing orbits roughly along one perpendicular line from Neptune and one object along another. "We plotted up the positions of those objects and their orbits, and they matched the simulations exactly," says Brown. "When we found that, my jaw sort of hit the floor."

"When the simulation aligned the distant Kuiper Belt objects and created objects like Sedna, we thought this is kind of awesome—you kill two birds with one stone," says Batygin. "But with the existence of the planet also explaining these perpendicular orbits, not only do you kill two birds, you also take down a bird that you didn't realize was sitting in a nearby tree."

Where did Planet Nine come from and how did it end up in the outer solar system? Scientists have long believed that the early solar system began with four planetary cores that went on to grab all of the gas around them, forming the four gas planets—Jupiter, Saturn, Uranus, and Neptune. Over time, collisions and ejections shaped them and moved them out to their present locations. "But there is no reason that there could not have been five cores, rather than four," says Brown. Planet Nine could represent that fifth core, and if it got too close to Jupiter or Saturn, it could have been ejected into its distant, eccentric orbit.

Batygin and Brown continue to refine their simulations and learn more about the planet's orbit and its influence on the distant solar system. Meanwhile, Brown and other colleagues have begun searching the skies for Planet Nine. Only the planet's rough orbit is known, not the precise location of the planet on that elliptical path. If the planet happens to be close to its perihelion, Brown says, astronomers should be able to spot it in images captured by previous surveys. If it is in the most distant part of its orbit, the world's largest telescopes—such as the twin 10-meter telescopes at the W. M. Keck Observatory and the Subaru Telescope, all on Mauna Kea in Hawaii—will be needed to see it. If, however, Planet Nine is now located anywhere in between, many telescopes have a shot at finding it.

"I would love to find it," says Brown. "But I'd also be perfectly happy if someone else found it. That is why we're publishing this paper. We hope that other people are going to get inspired and start searching."

In terms of understanding more about the solar system's context in the rest of the universe, Batygin says that in a couple of ways, this ninth planet that seems like such an oddball to us would actually make our solar system more similar to the other planetary systems that astronomers are finding around other stars. First, most of the planets around other sunlike stars have no single orbital range—that is, some orbit extremely close to their host stars while others follow exceptionally distant orbits. Second, the most common planets around other stars range between 1 and 10 Earth-masses.

"One of the most startling discoveries about other planetary systems has been that the most common type of planet out there has a mass between that of Earth and that of Neptune," says Batygin. "Until now, we've thought that the solar system was lacking in this most common type of planet. Maybe we're more normal after all."

Brown, well known for the significant role he played in the demotion of Pluto from a planet to a dwarf planet adds, "All those people who are mad that Pluto is no longer a planet can be thrilled to know that there is a real planet out there still to be found," he says. "Now we can go and find this planet and make the solar system have nine planets once again."


Segue também um video da NASA sobre o assunto

 
Topo Fundo